|
One objective of the models of choice is to evaluate how choices change as the set of alternative choices change. Demand relates observed choices to the price level for a commodity. Price changes are one form of change to the set of available alternative choices.
So the first problem that we need to address is how to represent the set of alternative choices that are available to a consumer.
|
|
One of the most common problems in consumer choice is the choice of a consumption level for each of a number of commodities, each with a fixed price, when income is fixed. It is not too difficult to formulate and analyze this type of problem even when the number of commodities is large, but the problem is greatly simplified and the ideas can be described graphically when there are only two commodities, so we begin the description of the consumer choice model for that case. If the consumption levels for commodities 1 and 2 are x1  0 and x2 0 and x2  0 then the consumption point is written x = (x1, x2), which is the quantity x1 of commodity 1 consumed, and the consumption x2 of commodity 2. The set of all possible consumption levels is written X = {(x1, x2) : x1 0 then the consumption point is written x = (x1, x2), which is the quantity x1 of commodity 1 consumed, and the consumption x2 of commodity 2. The set of all possible consumption levels is written X = {(x1, x2) : x1  0, x2 0, x2  0}. 0}.
|
|
Limited income and positive prices for each of the
two commodities produces a finite set of alternative choices, which is often called a choice or budget set. Suppose that income is
M = 120 and the prices of commodities 1 and 2 are
p1 = 12, and p2 = 8. Use this
to determine the total amount x1 of commodity 1 that you can purchase. Do the same if you spend all your income on commodity 2.
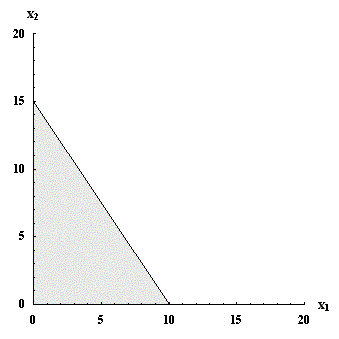
An example of a set of alternative choices is shown in figure 1. Compare the answers to the intersections of the budget set with the X1 axis and with the X2 axis.
|

Figure 1: Budget set with prices p1 = 12, p2 = 8, and income M = 120.
Next
|