|
|
| ||
Urban Land Rent
In this section we will take a look at the various factors effecting rents in the city and suburbs and examine how and why the rents increase as you move closer to the Central Business District. First, we must understand exactly what land rent is; it is the periodic payment by a land user to a land owner. Each piece of land or housing also will have a market value which is what is used to determine the rents. Distance from the CBD also affects rents. To go to work everyone has some sort of commute for which the cost can be measured according to this formula:
C = (cost to commute in one year per 1 mile)
C = 2 * trips per years ( mechanic costs + (wage/speed)Beta)
So, in order to compensate for a lower commuting cost by offering housing closer to the CBD, the rents in that area will be higher than where the commuting cost is a lot higher.

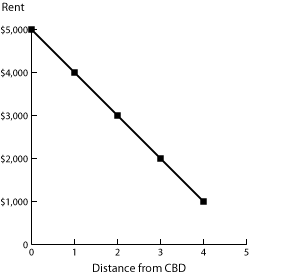
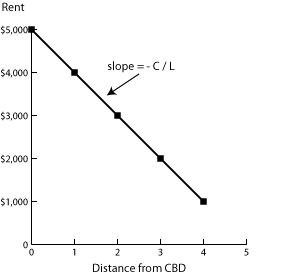
One of the most fundamental components of urban economics is the rent gradient. The rent gradient is in essence the slope of the bid-rent function. The rent gradient is:
(Change in Rent/Change in Distance) = (-Commuting Cost(C)/Lot Size(L))
The bid-rent function displays how rents change with distance to the CBD.

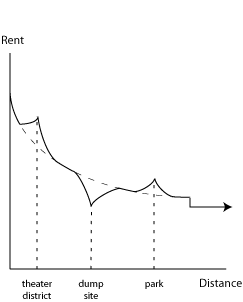
Rents can also be impacted by the type of place where one lives. For instance, if there is a theater district with a nice park, it will be more attractive to people to live there. In this case, rents will increase because people will be willing to pay more for a nicer area. This is also true for nicer schools and families. Those with children may be willing to pay more in rent so that their children can attend a nicer school than in other areas. The opposite is also true for areas that are not so nice. For instance, there may be a local dump which no one wants to live near. However, if the rent is low enough as it will have to be in order to attract anyone to live there, people may choose to live there and just sacrifice the smell in order to have a cheaper land rent. These subcenters can also be shown graphically.

| Copyright 2006 Experimental Economics Center. All rights reserved. | Send us feedback |


