|
|
| ||
Entering Data & Generating a Supply and Demand Chart
In order to create the supply and demand graph, enter the prices and quantities for the generic assets in the experimental market. The software screen fields are described below along with the methods for data entry and the creation of the supply and demand schedules.

Entering Data:
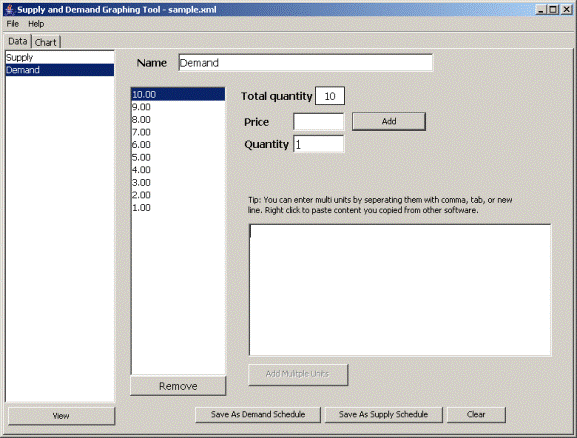
Name: This field is where you enter the name of the schedule you are creating. Usually these schedules are labeled as “Supply” or “Demand.” This label will also be present on the key located on the graph.
Total Quantity: This box will automatically change as the user adds/removes the number of assets.
Price: The price field is where the user enters the price where the buyer/seller agreed to trade.
Quantity: This field is where the number of market participants who agreed to trade for the price specified above is entered.
Add: After the user has entered the price at which the trade was made, this button will add the price and quantity to the supply/demand schedule.
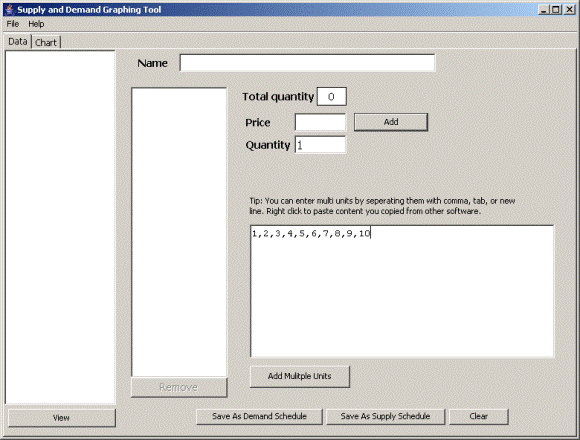
Adding Multiple Units: The large blank field located in the lower right of the software window can be used to enter multiple supply/demand units. This feature allows the user to copy and paste lists directly from spreadsheet or word processing software to quickly create a supply/demand schedule. In addition, the user can enter a list of prices for which trades were agree upon by buyers/sellers. These prices need to be separated with a comma, tab, or by creating a new line. An example is shown below.

Remove: To remove units (prices), select the unit price to be removed in the middle column (as shown below) then click the “Remove” button.
Clear: The clear button will allow the user to clear the contents of the multiple units field in the lower right of the software window.
Saving the Supply/Demand Schedule:
After all of the prices and quantities have been entered for the supply/demand schedule the next step is to save the list as either the supply or demand schedule.
Save as Supply Schedule: This button saves the active list as the supply schedule.
Save as Demand Schedule: This button saves the active list as the demand schedule.
View: This button allows the user to view the saved supply/demand schedules. First select the name of the schedule you wish to view, then click the “view” button to display the schedule in the active list.
Viewing the Chart:
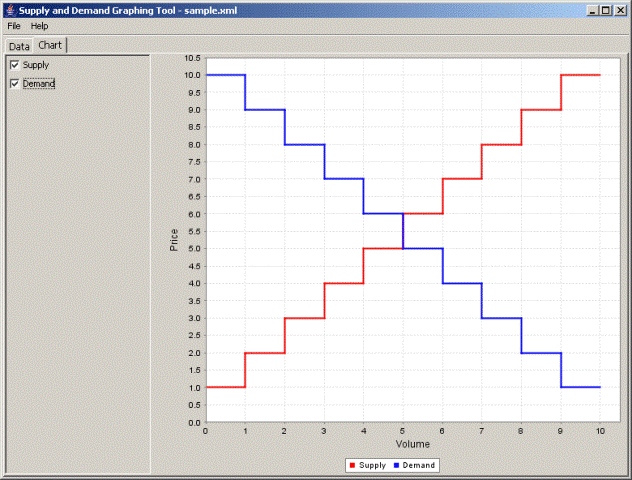
After the supply/demand schedule is saved, click the “chart” tab at the top of the software window to view the chart.
The graphed schedules can be added and removed from the graph by checking/un-checking the box next to the corresponding name.

| Copyright 2006 Experimental Economics Center. All rights reserved. | Send us feedback |


